Power Query - Get started in Excel
There is a feature in Excel called Power Query. Personally, I think this is one if the best feature in Excel. Despite this, I find that very few people are aware of it. It is a wonderful when you are analyzing data.
With Power Query you could easily combine and modify data automatically. If you know how to create SQL queries, this is something like that. But the data does not have to be in database server, you could combine data from Excel-files, CSV-files, webpages and mix it up in any why you like.
Power Query is not only used in Excel, it is also a fundamental part of PowerBI and could also be found in Azure Data Factory.
Get started
When you are working with Power Query, you need to have some data. The data could come from various sources, like a web server, a database server, a file etc. Tables in Excel works too, and we start with this because it is very simple. Copy this table into Excel:
| PlayerID | First name | Last name | Birth date | Country code |
|---|---|---|---|---|
| 1 | Alice | Aliceson | 1971-01-01 | SE |
| 2 | Bob | Bobsson | 1972-02-02 | NO |
| 3 | Carol | Carlsson | 1973-03-03 | SE |
| 4 | David | Davidsson | 1974-04-04 | NO |
| 5 | Eric | Ericsson | 1975-05-05 | DK |
| 6 | Frank | Franksson | 1976-06-06 | FI |
| 7 | Georg | Georgsson | 1977-07-07 | NO |
| 8 | Henrik | Henriksson | 1978-08-08 | SE |
Select the table, and then select Data and then From Table/Range.

If you are being asked to create a table, just click OK.
Next you will get a new window that look like this:
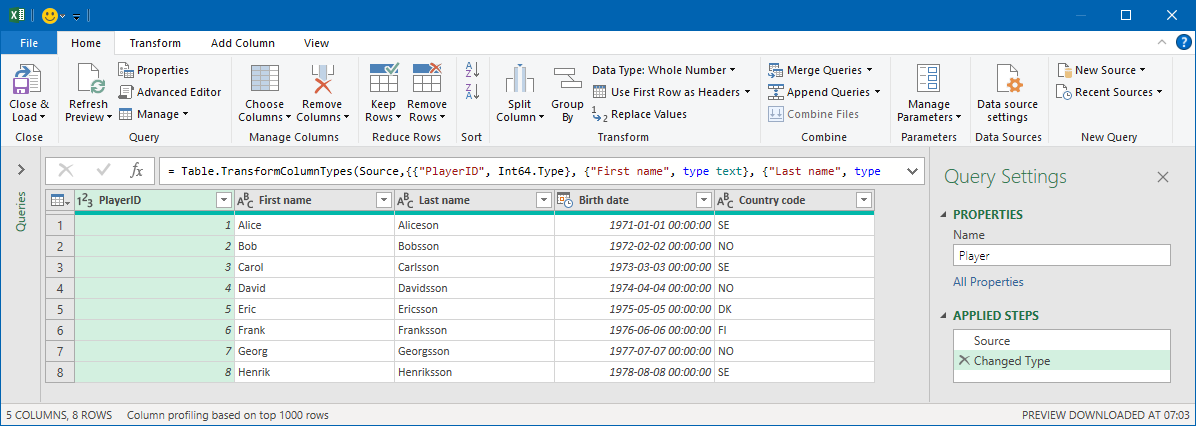
There is a lot of things in here, so it is easy to get a bit intimidated by this at first. This is the Power Query Editor and hopefully you will soon be comfortable with this :-) For now, we will keep it as simple as possible. In Properties > Name enter Player. This is the name of this data query. When you are working with several queries, it helps if they have good names.
Next, click on Close & Load in the upper left corner. After that, Excel will look like this:
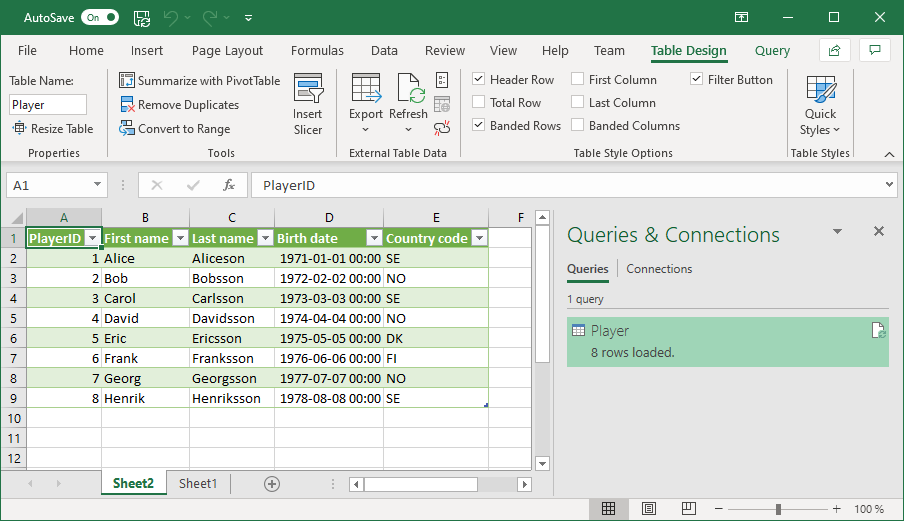
As you see, you now have two sheets. In Sheet1 you have your original data, in Sheet2 you have this green table. They look pretty much the same, so what is the point of this?
Data queries will just end up as virtual a table with data. This is just pure data; it does not have any colors or even a look. What you see in Sheet2 is just a representation of this data. This sounds a bit abstract at first, but it is a useful concept. There will be cases where you just want to have data but does not want to show it.
Now remove Sheet2 from your spread sheet. Is all the work we have done now in Power Query now removed? No, it is still in there, you just cannot see it. In the right side in Excel you see the panel Queries & Connections (if you do not see it, click on Data > Queries & Connections).
In this panel, you see all your queries. For now, there is only one named Player. You could (but do not do it now) double click on this to open the Power Query editor again. But instead, right click on Player and select Load To…
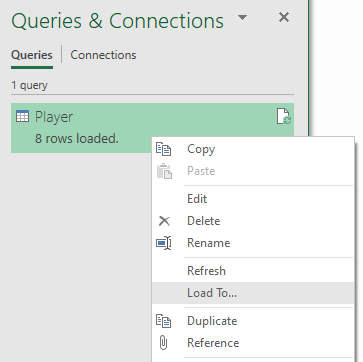
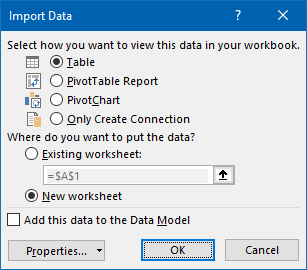
We are doing this because we want to see that data again. Now you get questions on how this should be visualized, select Table > New worksheet and make sure New worksheet is selected. Click OK.
Now you should see your data again in a new green table. This way you could easily visualize your data if you need to.
Refreshing data
Now, go back to your original data on Sheet1. Change a name of the player, then go back to the sheet where you visualize the data. As you see, the old name is still shown. Oh, so upsetting!
The reason for this is that Excel does not automatically update your data queries when you are editing a cell. This is a difference compared to ordinary formulas. Instead we need to instruct Excel to refresh the data.
There are two ways to do this. If you just have one query you want to refresh, in the Queries & Connections panel you could just click on the Refresh button.
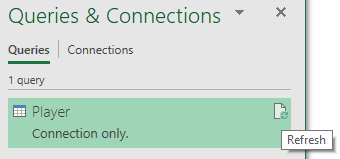
Another options, is to use Data > Refresh all.

This especially useful if you want to refresh several queries. Use any of these options and you will see that you now have the same data on both sheets.
Summary
You can check the final result of this part in this file: power-query-part-1.xlsx.
In this tutorial you have learned how to create a query from a table in Excel. You have also learned how to visualize this query in Excel.
But still, you probably still wondering what the point of all this is. Where is the power? It will be more interesting when we will look deeper into the Power Query editor in the next part: Power Query - Working with columns.